Physical Violence in Parliaments Worldwide
A Busy Month
In this post, I’ll continue my saga of posting at least one visualisation related to Political Science per month this year. Usually, it should’ve gone online earlier. However, February has been pretty busy for me, so I was only able to upload it by now.
Today, we’ll take a glimpse at the third version of the FISTS, which stands for Fistfights in parliamentary Sessions Time Series. The dataset was organised and recently updated by Professors Moritz Schmoll and Wang Leung Ting, and is the cornerstone of their paper published in the Journal of Conflict Resolution.
How have I come across the data? I was basically scrolling down my feed on Bluesky when I stumbled across a post from Ting announcing a new version of the dataset. Shortly afterwards, I thought that the data could provide a couple of interesting visuasalitions. After all, what else could be as interesting as getting to know which countries have a strong historic of parliamentarians fighting one another or how common the physical violence has been in some places?
Countries with the most annual incidences of fistfighting
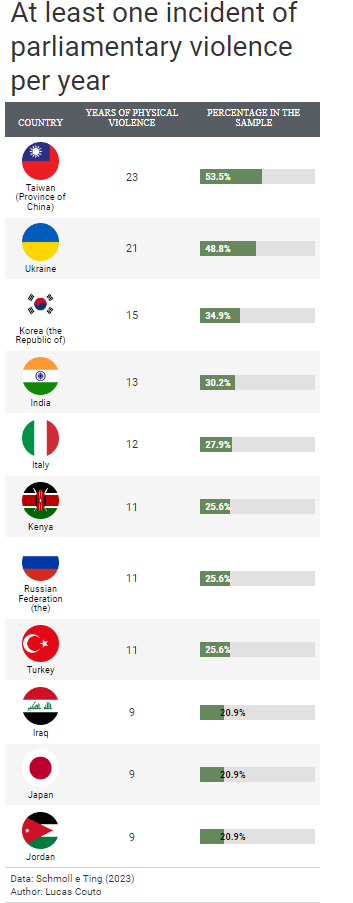
The first thing I want to have a look at is which countries have most often registered at least one incidence of fighting among lawmakers per year. To do so, I basically checked the variable countb
I didn’t want to make anything so fancy and it’s been a while since I last made a table with gt. Taken together, this led me to make a simple table, which I recognise that could be wayyy fancier. In any case, here we have
